The Best Fluffy Pancakes recipe you will fall in love with. Full of tips and tricks to help you make the best pancakes.


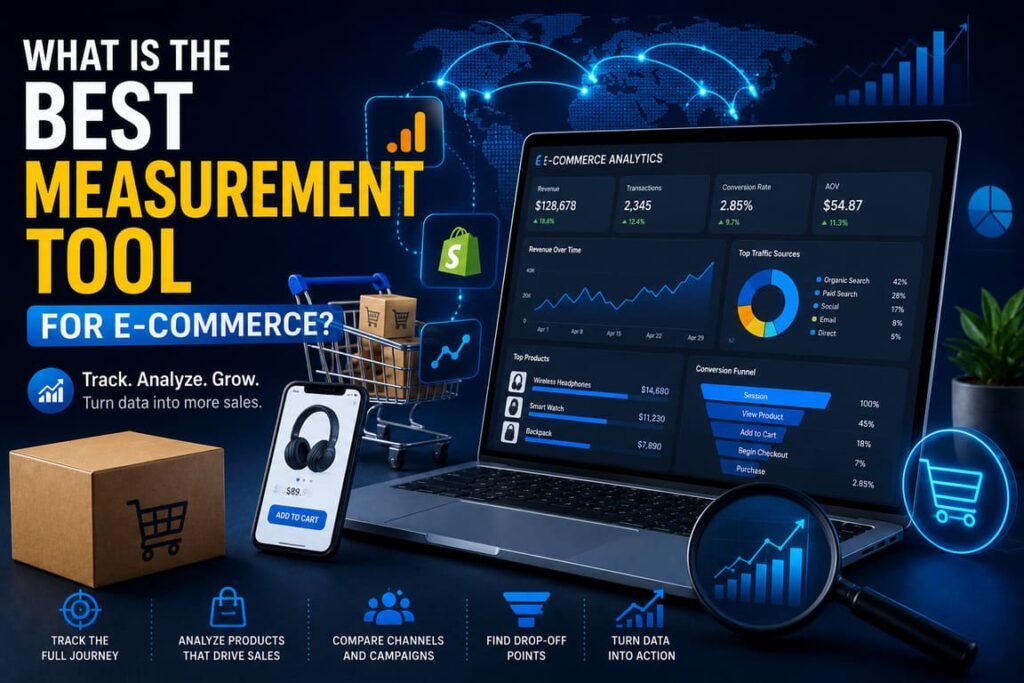
If you want one clear answer, Google Analytics 4 (GA4) is the best single measurement tool for most e-commerce businesses. It gives you a full view of how shoppers move from product view to purchase, supports event-based tracking, and helps you measure products, funnels, traffic sources, promotions, and revenue in one system. If you run a Shopify store, the most practical setup is GA4 + Shopify Analytics: use GA4 for customer journey analysis and Shopify Analytics for store-level sales, merchandising, and operational reporting.
Why this question matters
E-commerce is now a major part of retail. In the first quarter of 2026, U.S. retail e-commerce sales reached $326.7 billion and accounted for 16.9% of total retail sales. When the market is this large, measuring performance is no longer optional. You need to know where people drop off, which channels bring buyers, which products convert, and what slows customers down. Source
What a good e-commerce measurement tool must do
A strong measurement tool should do five simple things well:
- Track the full buying journey, not just final sales.
- Show product-level data, not only traffic numbers.
- Help you compare channels, devices, and campaigns.
- Make it easy to find drop-off points in the funnel.
- Turn data into action, such as better pages, better ads, and better checkout decisions.
That is exactly why GA4 stands out for most stores. Google’s e-commerce setup is built around shopper actions such as view_item, add_to_cart, begin_checkout, and purchase, so the tool follows how people actually shop.
Why Google Analytics 4 wins for most stores
GA4 is the best overall choice because it measures the whole e-commerce journey with an event-based model. Instead of only counting sessions, it tracks what users actually do: view products, select items, add to cart, start checkout, add shipping info, add payment info, complete purchases, and even request refunds. That structure makes it much easier to understand the path to revenue.
Google also states that GA4 e-commerce measurement helps businesses see what customers like, how marketing performs, what products people buy, and how to improve the store to increase sales and engagement. After setup, the data can also be used for audience building and ad platform activation.
For Shopify brands, the smartest real-world setup is not “GA4 alone.” Shopify itself recommends combining Google Analytics with Shopify Analytics because GA4 is strong for visitor behavior modeling, while Shopify Reports are better for sell-through rates, merchandising mix, and store-native reporting.
Table 1: Best measurement tools by use case
| Use case | Best tool | Why it fits | Best for |
|---|---|---|---|
| Best single tool for most e-commerce stores | Google Analytics 4 | Tracks the full funnel with event-based e-commerce data | Brands that want one main source for traffic, funnel, and revenue analysis |
| Best native reporting for Shopify stores | Shopify Analytics | Built into the store and strong for sales, orders, inventory, and merchandising reports | Shopify merchants who need fast operational reporting |
| Best enterprise option | Adobe Customer Journey Analytics / Product Analytics | Strong cross-channel analysis, guided funnel work, audience activation, and flexible data modeling | Large brands with multiple teams, channels, and data sources |
| Best practical stack for Shopify | GA4 + Shopify Analytics | Combines journey analysis with store-native business reporting | Most small to mid-size Shopify brands |
This comparison is based on official GA4 e-commerce documentation, Shopify reporting documentation, Shopify’s GA4 implementation guide, and Adobe’s enterprise analytics materials.
How it works in real life
GA4 works by sending e-commerce events every time a shopper takes an important action on your site. Each event can include item-level details such as product ID, name, brand, variant, category, price, quantity, discount, and coupon data. This means you do not just see “someone visited.” You see what they looked at, what they added, what they skipped, and what they bought.
A practical flow looks like this:
- A shopper lands on your site from Google, Instagram, email, or direct traffic.
- They view a product page.
- They add one or more items to the cart.
- They start checkout.
- They complete the purchase.
- GA4 records each step, so you can see where conversion drops.
Text infographic: how e-commerce measurement should flow
RAFFIC SOURCE
Google / Meta / Email / Direct
        │
        ▼
PRODUCT DISCOVERY
view_item_list → select_item → view_item
        │
        ▼
BUYING INTENT
add_to_cart → view_cart → begin_checkout
        │
        ▼
CHECKOUT QUALITY
add_shipping_info → add_payment_info
        │
        ▼
REVENUE
purchase
        │
        ▼
OPTIMIZATION
Fix weak pages, improve offers, speed up checkout, refine campaigns
This event flow follows the recommended GA4 e-commerce structure and is the reason GA4 is so useful for practical optimization, not just reporting.
The statistics that matter most
Here are the numbers that explain why the right measurement tool matters:
- 70.22% is the average documented online shopping cart abandonment rate. Baymard Institute
- Among shoppers who abandon checkout for actionable reasons, 39% leave because extra costs are too high, 21% because delivery is too slow, and 18% because checkout is too long or complicated.
- Shopify cites global e-commerce conversion benchmarks of 1.6% and 2.95%, depending on the data source.
- Shopify also lists wide category differences, from 6.22% in food and beverage to 0.94% in luxury and jewelry.
- Shopify’s large-scale performance analysis found that for every 100 milliseconds slower a store loads, conversion tends to be about 3.5% lower.
- The same analysis found that for every 32 milliseconds slower a store responds to interactions, conversion tends to drop by about 1.5%.
- Adobe’s 2025 study of 1,000+ U.S. consumers found that only 9% of shoppers browse late at night, but they spend the most per year, averaging $3,684 annually. Adobe
These numbers show a simple truth: if you do not measure the funnel properly, you will miss real money.
The best professional setup: a simple guide
If you want a practical setup that professionals use, follow this process.
1. Start with one source of truth for customer behavior
Install GA4 correctly and make sure key e-commerce events are firing. Do not stop at page views. At minimum, track product views, add to cart, checkout start, and purchase. If you skip these steps, your data will look “busy” but not useful.
2. Use your commerce platform’s native reports too
If you run Shopify, keep Shopify Analytics active. It is useful for sales, orders, customer, inventory, profit, and mar
3. Match your business settings
Shopify’s GA4 guide recommends matching time zone and currency settings between platforms, setting conversion events properly, validating data, and using UTM parameters to improve attribution. Small setup mistakes create big reporting errors later.
4. Focus on a small KPI set first
Most teams track too much too early. Start with revenue, conversion rate, add-to-cart rate, checkout completion rate, average order value, cart abandonment, and top-performing products. Once these are stable, add deeper analysis.
5. Measure friction, not only success
Your best insights usually come from what is not working. Baymard’s research shows that cost surprises, slow delivery, trust issues, forced account creation, and long checkout are major reasons for abandonment. Your measurement tool should help you spot these friction points early.
6. Segment by device, channel, and timing
Adobe’s research shows that shopping behavior changes by time of day, device, and user context. A good measurement setup should let you compare mobile vs desktop, paid vs organic, and weekday vs weekend or late-night behavior.
7. Turn reports into weekly actions
A measurement tool is only useful if it changes decisions. Every week, your team should ask: Which product pages underperform? Which channels bring buyers, not just clicks? Where do shoppers abandon checkout? Which pages are slow? Then make one improvement, measure again, and repeat.
Table 2: The KPI playbook every e-commerce store should track
| KPI | What it tells you | Where to measure it | What to do if it is weak |
|---|---|---|---|
| Conversion rate | How many visits become purchases | GA4 + platform reports | Improve product pages, trust signals, and offers |
| Add-to-cart rate | Product page buying intent | GA4 | Improve images, copy, pricing clarity, and CTA |
| Checkout completion rate | Checkout efficiency | GA4 + platform checkout reports | Remove friction, shorten forms, add payment options |
| Average order value | Revenue efficiency | GA4 + platform sales reports | Test bundles, upsells, volume offers |
| Cart abandonment rate | Lost buying intent | GA4 + checkout reports | Show full costs earlier, simplify checkout |
| Revenue by channel | Marketing quality | GA4 | Shift spend toward channels that convert |
| Product-level performance | SKU winners and losers | GA4 + platform product reports | Push winners, fix or retire weak listings |
| Site speed / responsiveness | Experience quality | Platform performance dashboard + analytics | Improve load time, remove heavy scripts, audit apps |
This KPI set is built from Google’s e-commerce event model, Shopify reporting guidance, Shopify conversion guidance, and Shopify’s speed/conversion research.
Real examples
Example 1: Gina Tricot
Gina Tricot used Google Analytics data together with BigQuery and Looker to create a more unified measurement system across marketing, customer, sales, and inventory data. According to Google Cloud, that work contributed to around a 1.0 billion SEK increase in year-over-year revenue from 2024 to 2025, plus a double-digit increase in return on ad spend. This is a strong example of why a solid measurement foundation can drive better decisions, not just prettier dashboards.
Example 2: OTTO
OTTO uses Adobe Customer Journey Analytics to combine website and product metadata, allowing teams to test things like product description length, image choices, landing page design, and wishlist experiences. Adobe says OTTO runs up to 40 optimization cycles, with more than 300 employees having access to integrated analysis. This is what enterprise-grade measurement looks like when scale and flexibility matter most.
Example 3: Bull & Cleaver
In Shopify’s GA4 guide, Bull & Cleaver owner Daniel Patricio explains that he uses Google Analytics for visitor behavior modeling and Shopify Reports for sell-through rates and merchandising mix. This is a very realistic example for small and mid-size brands: do not force one tool to do everything if a simple two-tool setup gives cleaner decisions.
Common mistakes to avoid
- Tracking only traffic, not purchase steps.
- Looking at total sales without product-level analysis.
- Ignoring mobile behavior.
- Ignoring site speed.
- Using reports but not validating event setup.
- Measuring clicks instead of revenue.
- Treating all channels as equal instead of comparing assisted and last-step impact.
These mistakes are common because teams often install analytics but do not build a real e-commerce measurement model around it. Official GA4 and Shopify guidance both stress setup quality and validation.
FAQ
Is GA4 enough for e-commerce?
For many stores, yes. GA4 is enough as the main measurement tool if it is configured properly. But many brands still benefit from combining it with their platform’s native analytics, especially on Shopify.
Is Shopify Analytics better than GA4?
Not overall. Shopify Analytics is better for native store reporting such as orders, product mix, inventory, and merchant-facing operational data. GA4 is better for shopper journey analysis, traffic sources, and event-based funnel measurement. They work best together.
When should a business choose Adobe instead?
Adobe makes sense when the business is large, multi-team, multi-channel, and needs deeper flexibility, guided product analysis, audience activation, and broader data integration. It is the stronger fit for enterprise organizations than for a typical small store.
What should I track first?
Start with view_item, add_to_cart, begin_checkout, and purchase. Then add product-level dimensions, promotions, refunds, and audience segments.
What is the biggest metric most stores should fix first?
Usually it is not “traffic.” It is either checkout friction or poor product-page performance. Baymard’s abandonment data and Shopify’s conversion guidance both point to these as major growth opportunities.
Final verdict
Best single measurement tool for e-commerce: Google Analytics 4.
Best practical setup for Shopify stores: GA4 + Shopify Analytics.
Best enterprise option: Adobe Customer Journey Analytics / Product Analytics.
If you want a tool that is practical, flexible, and useful for daily decision-making, GA4 is the strongest answer for most businesses. It measures how people actually shop, shows where revenue is won or lost, and gives you a clear base for improving product pages, marketing, and checkout.